What We Shipped This Summer: Built-In Metrics, a Redesigned AutoSchedule, and Smarter Notifications
This has been the busiest stretch of shipping in LIMSey’s history: eight releases between June and mid-August, nearly all of them driven by things our customers asked for. Here’s a tour of the highlights. If you want the full details on any release, complete notes ship in-app with every version — and the running list of highlights lives on our changelog.
Metrics: lab analytics, built in
For years, answering questions like “what’s our median turnaround time?” or “which test fails most often?” meant exporting data to external reporting tools. The new Metrics area brings those answers into LIMSey itself.
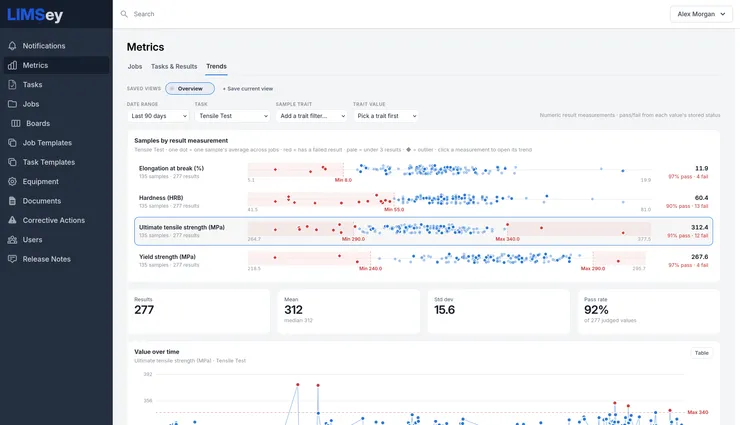
Three tabs share one workspace. Jobs covers throughput and cycle time: jobs created per week, median lead time computed from each job’s actual status history, on-time performance, and time spent in each status. Tasks & Results covers testing volume and outcomes: results recorded per week, pass and fail rates, and failure hot spots that surface the task-and-measurement combinations failing most often. Trends is built around result measurements — control charts of individual values with pass/fail criteria zones drawn in, statistical outliers flagged, and per-job rollups a click away.
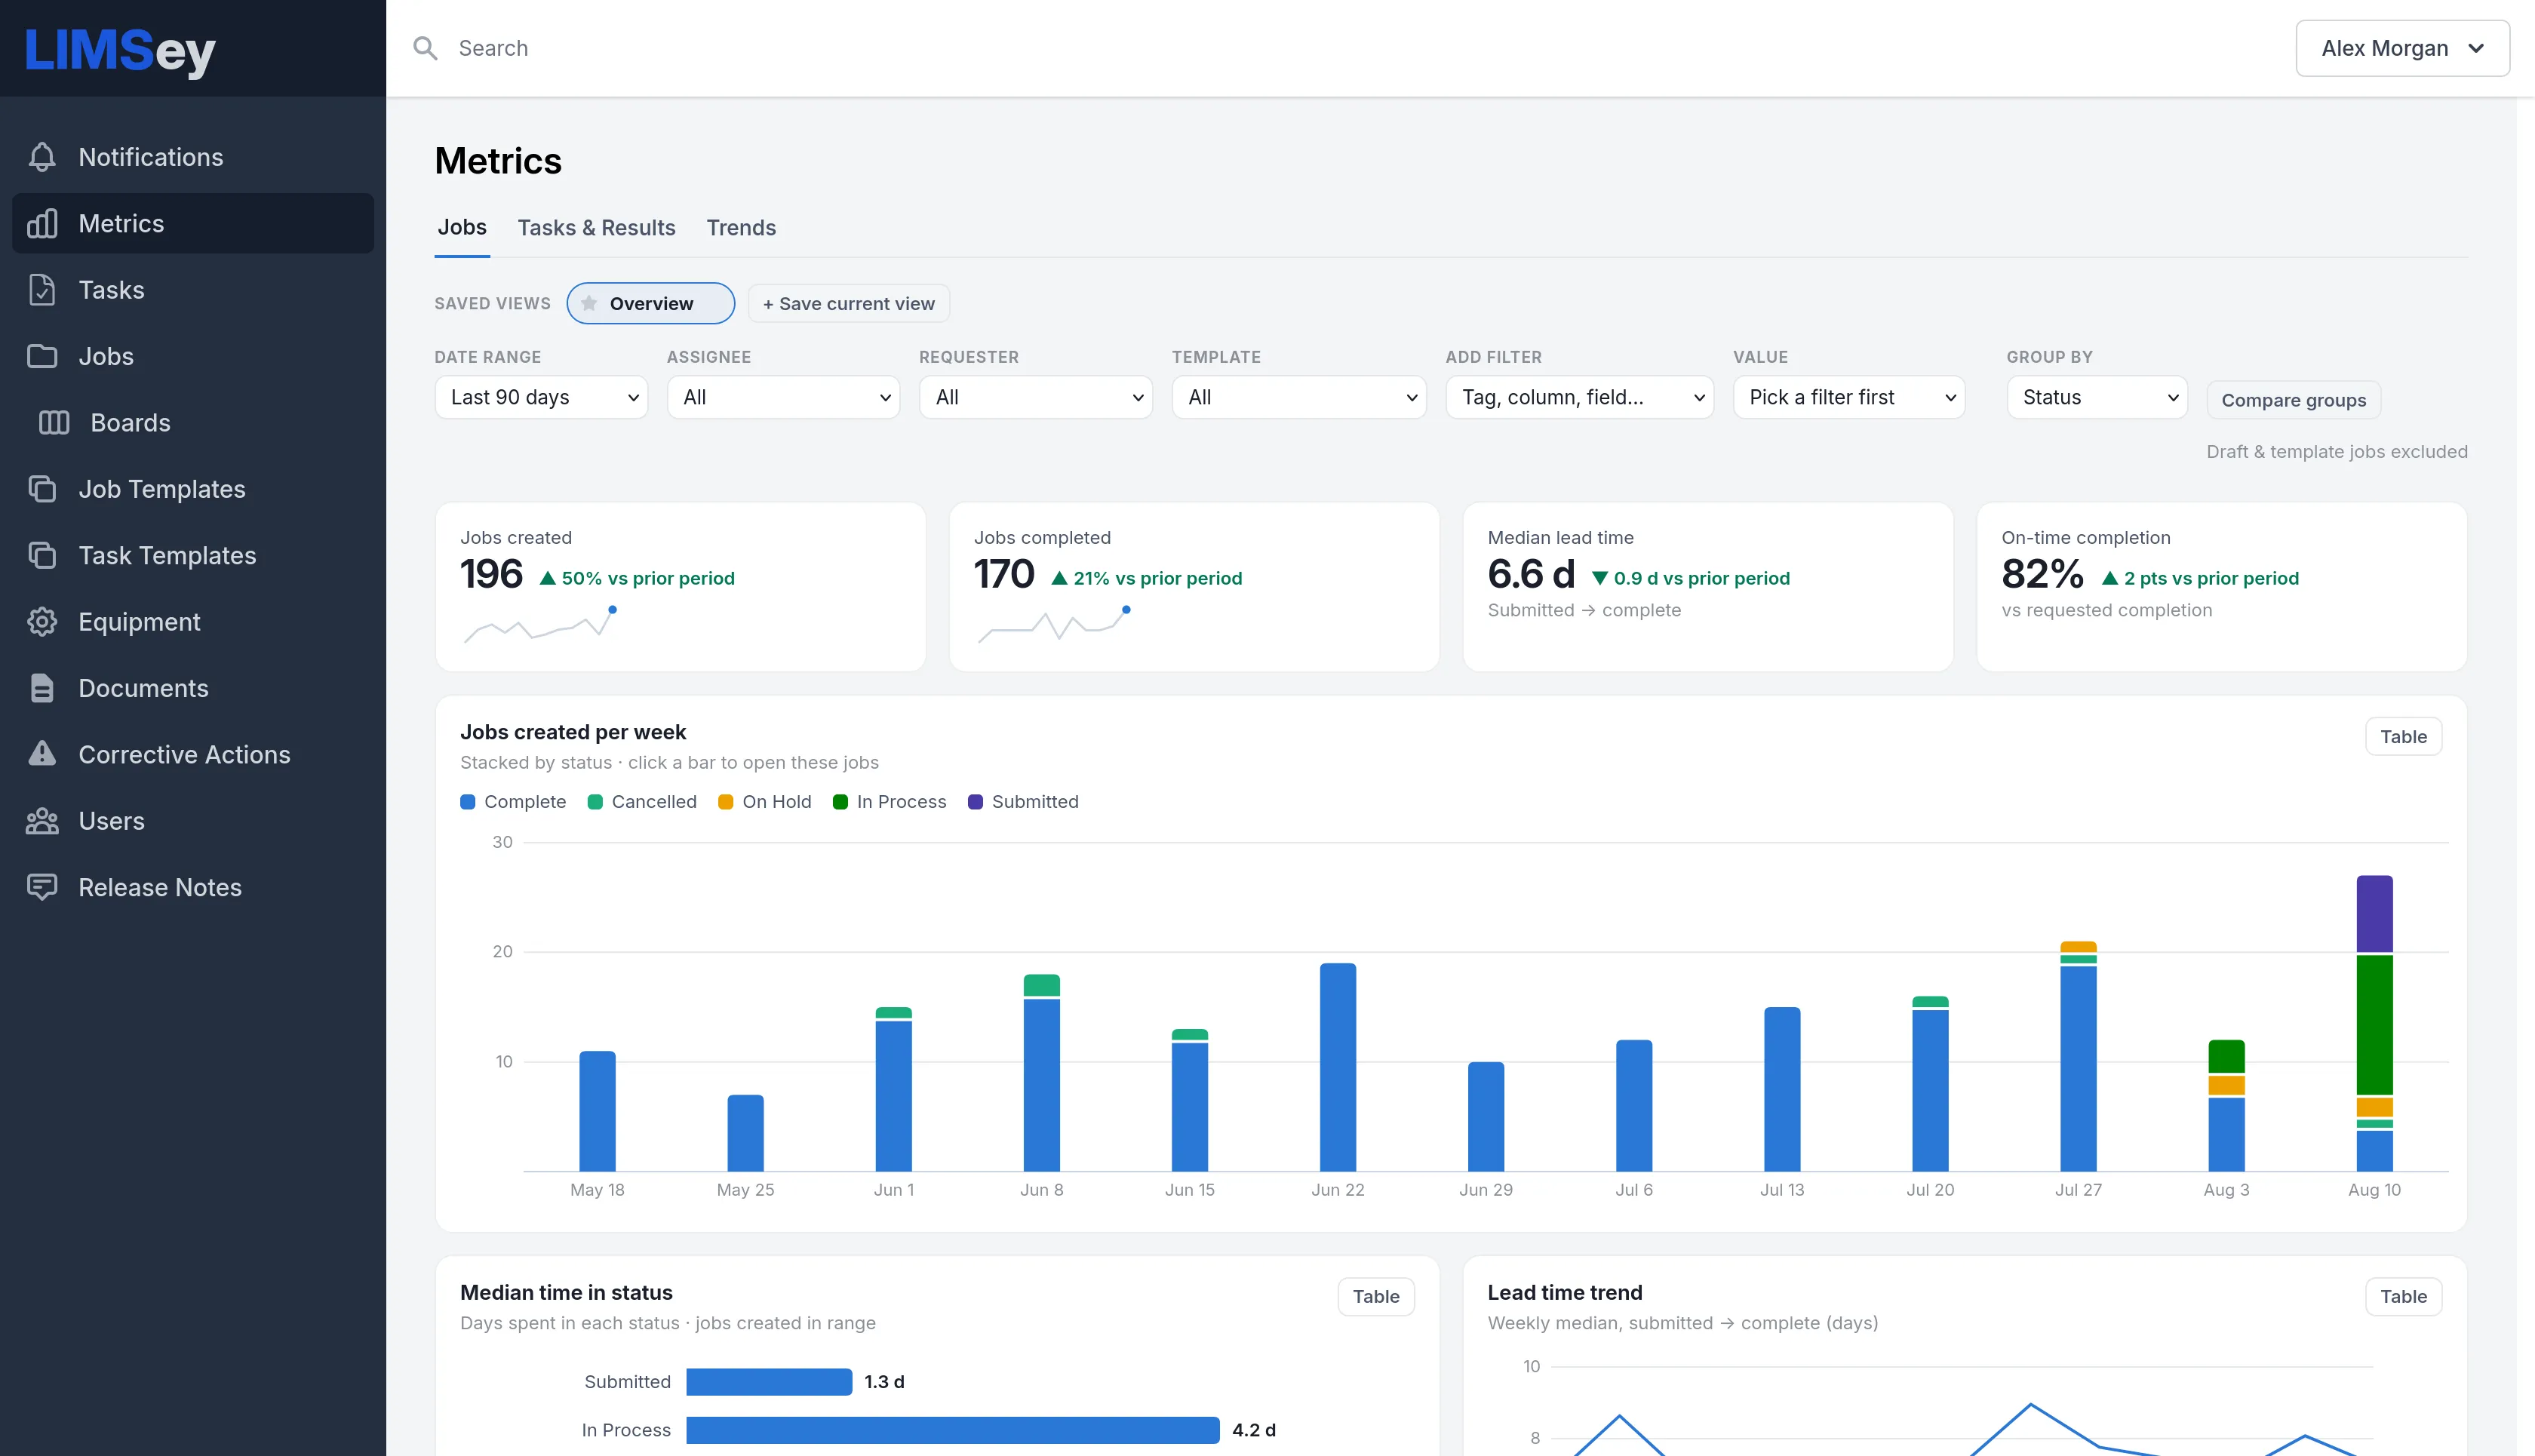
Every view filters the same way, any combination of filters saves as a named view for one-click recall, and comparison groups let you pin up to three filter sets side by side. It’s engineered to stay fast on large accounts — even the heaviest views render in under a second.
Alongside Metrics, every job’s tasks screen gained a Results Summary card: one strip per measurement, one dot per sample, failures in red, outliers flagged — a one-glance picture of how the job’s samples measured up.
AutoSchedule, redesigned end to end
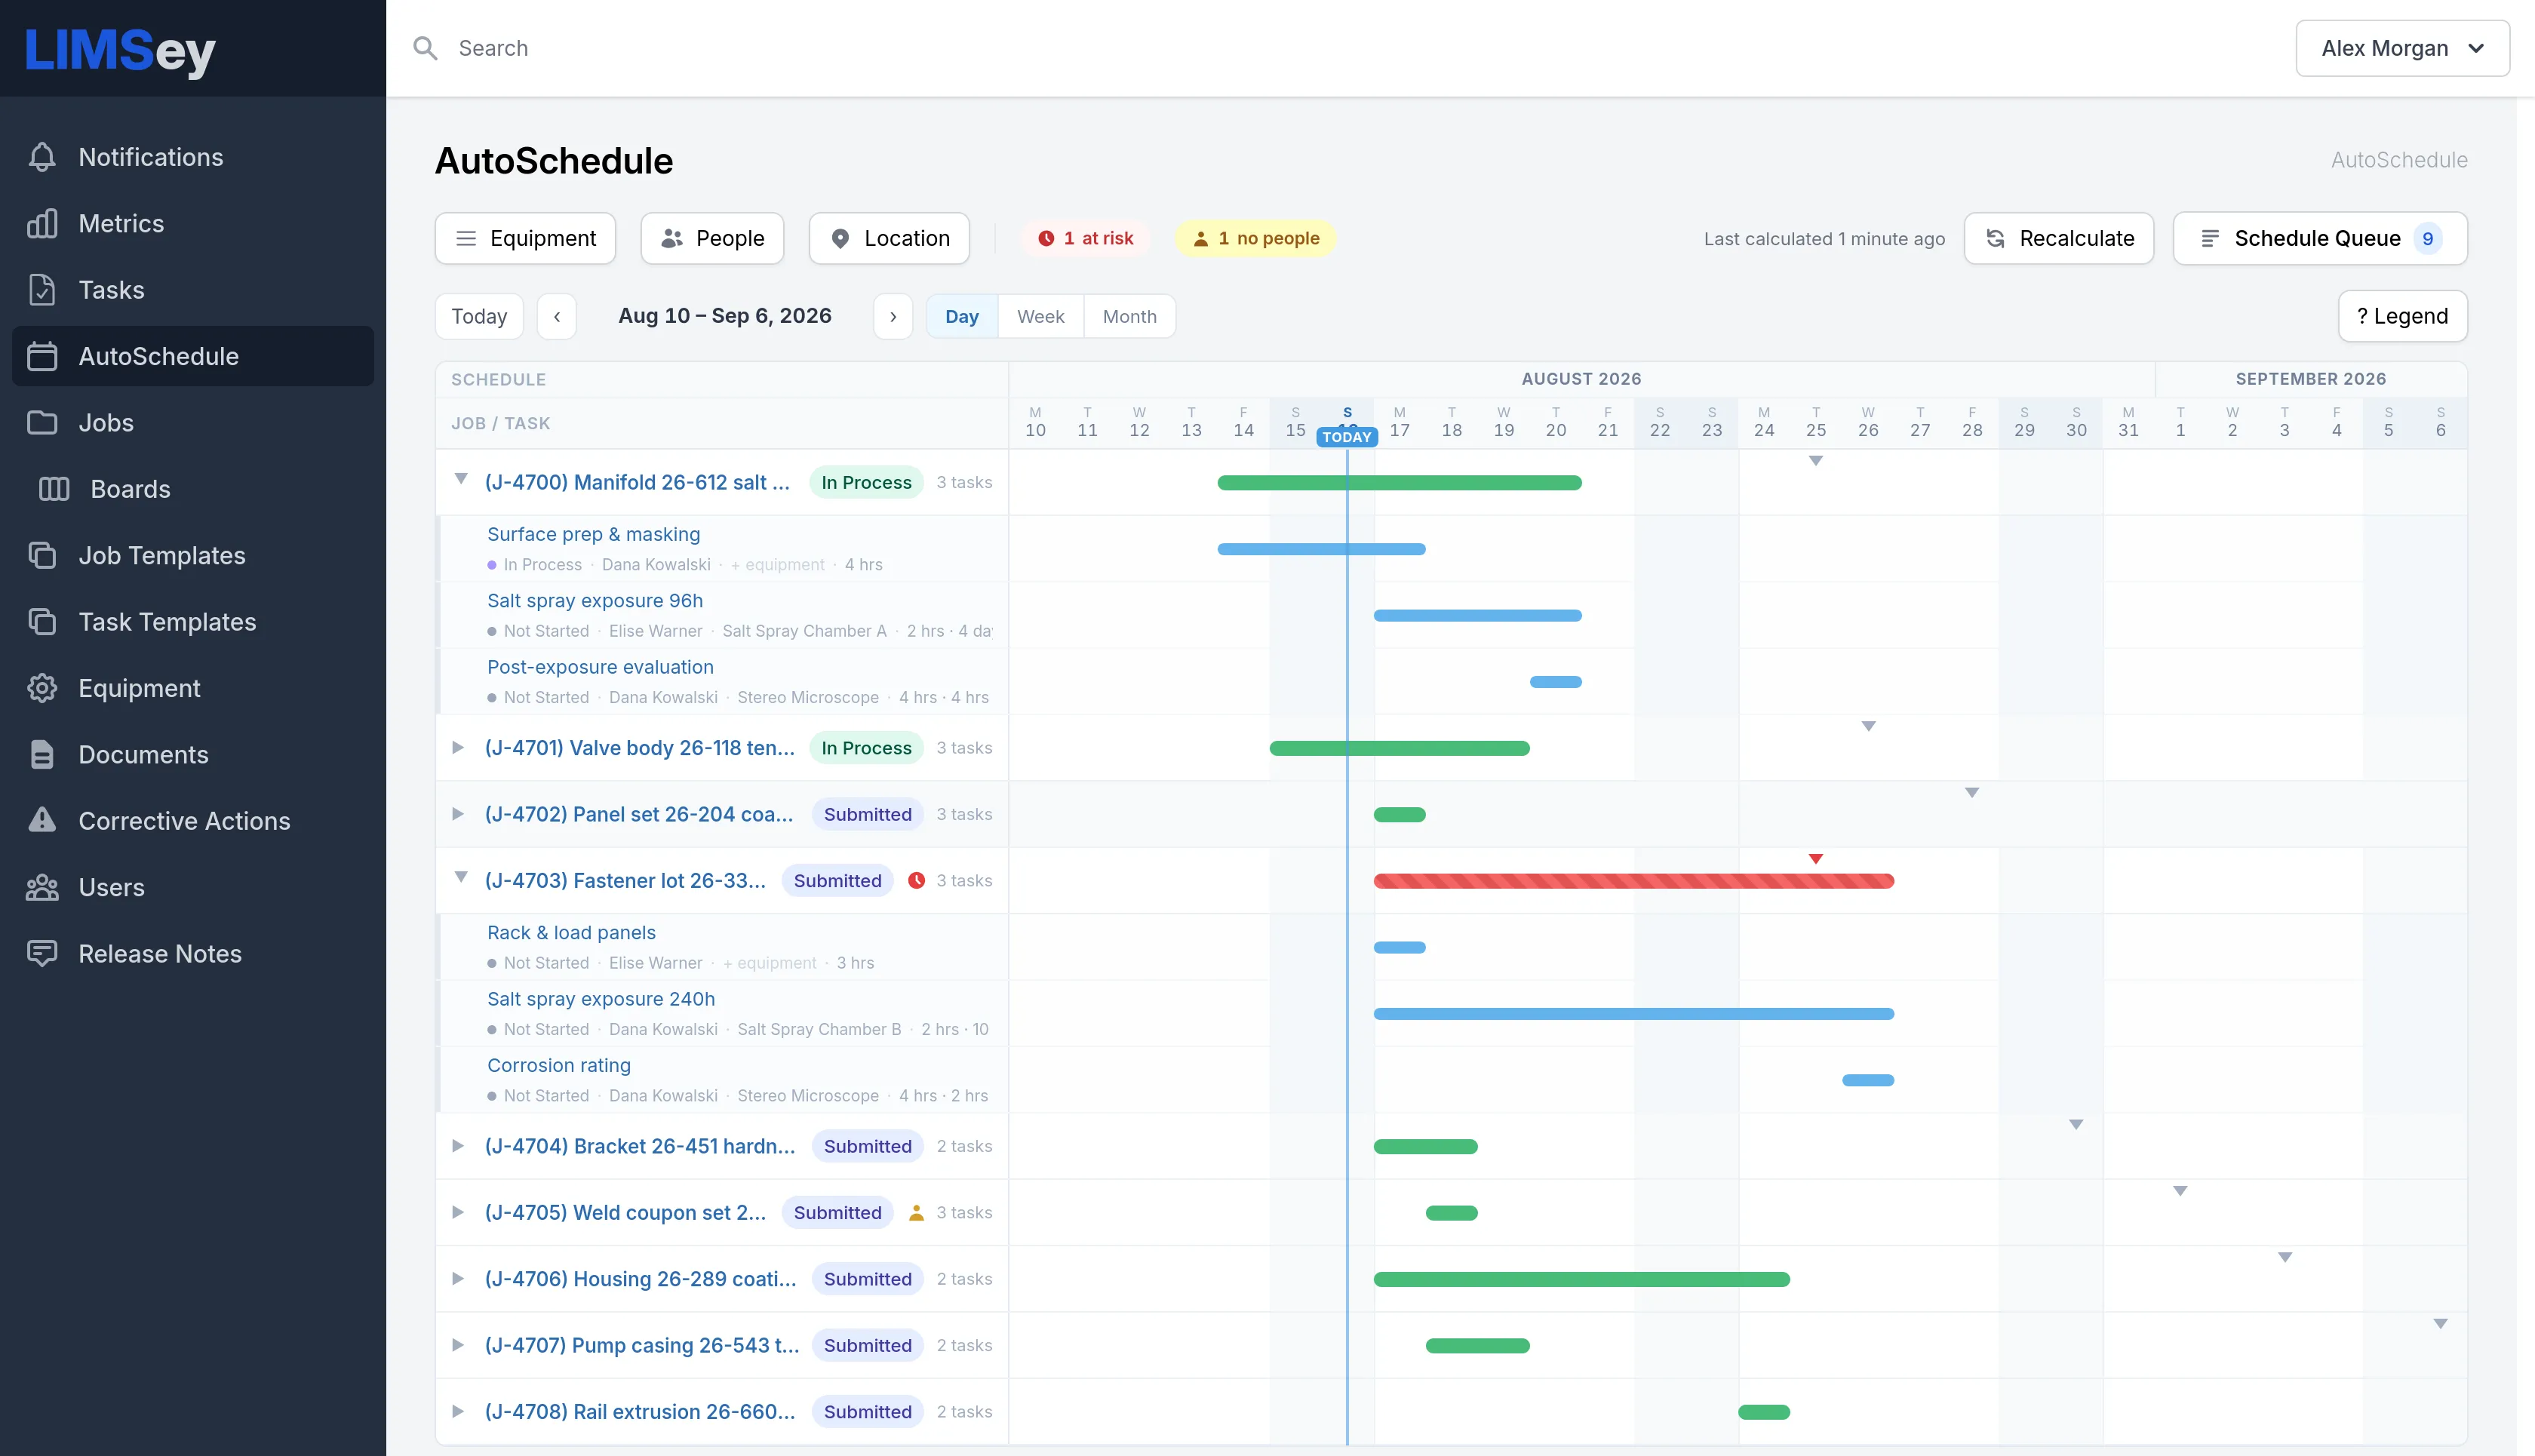
Automated scheduling got rebuilt from the ground up. Jobs now enroll themselves in the schedule when they enter a schedulable status and drop out when they leave it. People and equipment pools can be defined with tags, so “second shift” resolves to whoever is on that tag at every scheduler run. New Time Off and Planned Downtime entries describe when a person or a machine is unavailable, and the scheduler packs work around them.
The schedule itself is now a rolling, forward-looking timeline with day, week, and month zoom. Jobs render as single rows that expand to their tasks on demand, jobs whose estimated completion lands after their requested date are flagged as at risk, and a row of attention chips summarizes jobs that are late, unscheduled, or missing people or equipment — each chip doubling as a filter. Best of all, the schedule keeps itself fresh: changes to tasks, availability, or downtime trigger an automatic recalculation.
Notifications that read like sentences
We replaced the notification system with a single rules engine. Every notification now comes from a rule that reads as a sentence: when an event happens, on a set of jobs, notify these people, through these channels.
The event catalog covers everything the old triggers could express and plenty they couldn’t — being assigned to a task, a job sitting in the same status for a number of days, equipment status changes, a document revision being published. Rules deliver to the in-app inbox and can additionally send an instant email, roll into a daily digest, or send a text, each arriving at the recipient’s chosen hour in their own time zone. Existing triggers, watches, and subscriptions converted to editable rules automatically — nothing to rebuild.
Reports worth putting your name on
The August release redesigned the default job and task PDF reports from the ground up: cover pages, running headers and footers with page numbers, a navigable outline in PDF viewers, and faithful rendering of formatted notes, embedded images, and photos. Accounts using report revisions get a revision history table and a repeating DRAFT watermark on draft generations, and a per-account accent color and logo let reports carry your lab’s branding.
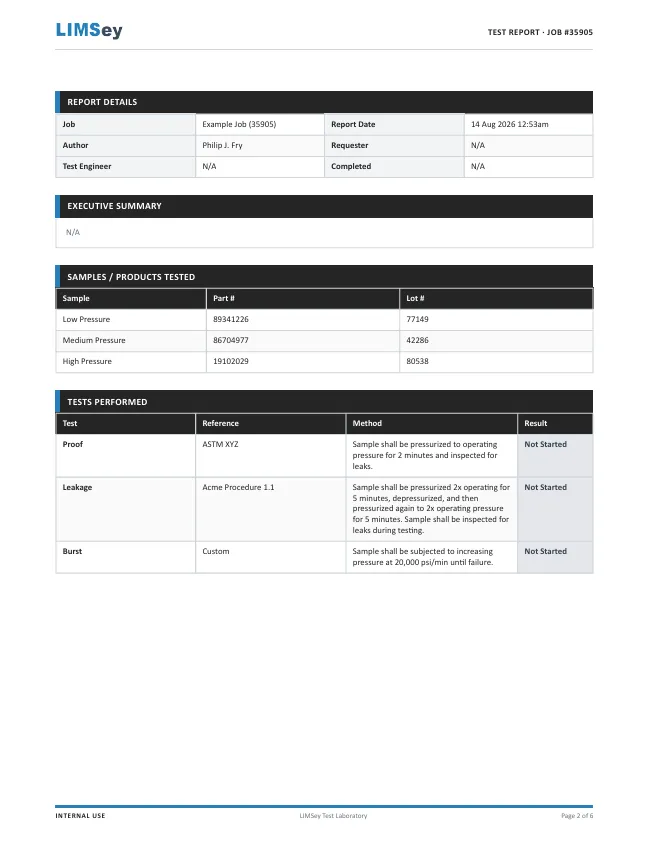
Related jobs can now be linked into named job groups, each with a combined report: one PDF spanning every job in the group, rolling results up across jobs with per-task and per-sample summary tables. And a new Job Costing page tracks what a job costs across labor, equipment, inventory, and per-task base costs — with rates that copy down from account defaults but belong to the job afterward, so later rate changes never rewrite history.
And a stack of quality-of-life improvements
- Test batteries bundle task templates into a named, ordered set added to a job in one action.
- Guided template questions walk requesters to the right job template instead of one long list.
- Spreadsheet paste drops a block of cells from Excel or Google Sheets straight into the samples or results table — audit history, formulas, and pass/fail evaluation all behave as if it were typed.
- QR sample labels print for a whole job in one PDF, with the traits you choose on each label.
- Magic link sign-in lets users skip passwords with a one-time emailed link.
- The jobs index was rebuilt around saved views — pinnable tabs with live counts — and loads substantially faster on large accounts.
Tell us what to build next
Most of what’s above started as a customer request. If there’s a feature your lab is missing, tell us — and if you’d like to see any of this live, book a demo.