See exactly how your lab is performing
Built-in metrics answer the questions every lab gets asked — and fully custom dashboards, built for you, handle the ones only yours does.
Built-in Metrics: answers with zero setup
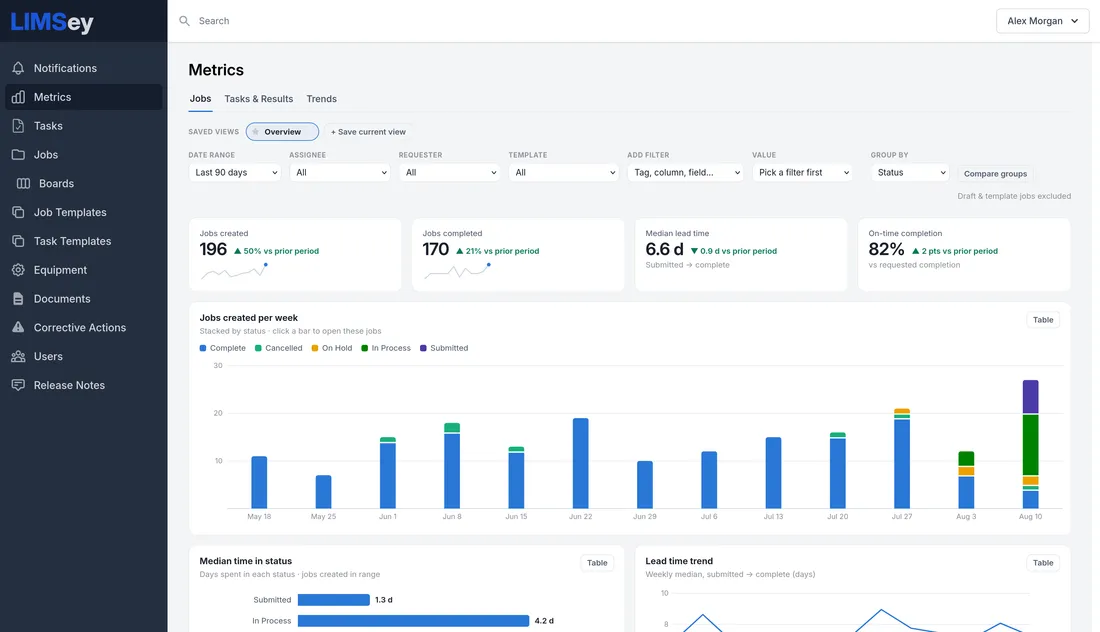
"What's our median turnaround time?" "Which test fails most often?" The Metrics area answers the questions every lab manager gets asked — computed straight from your jobs, tasks, and results, with nothing to configure. Save any combination of filters as a named view, and pin up to three groups side by side to compare.
- Jobs — throughput, median lead time, on-time performance, and time in each status
- Tasks & Results — pass and fail rates, with hot spots surfacing the tests that fail most
- Trends — control charts of any measurement, with criteria zones and outliers flagged
- Fast on large accounts — even the heaviest views render in under a second
Fully custom dashboards — built for you
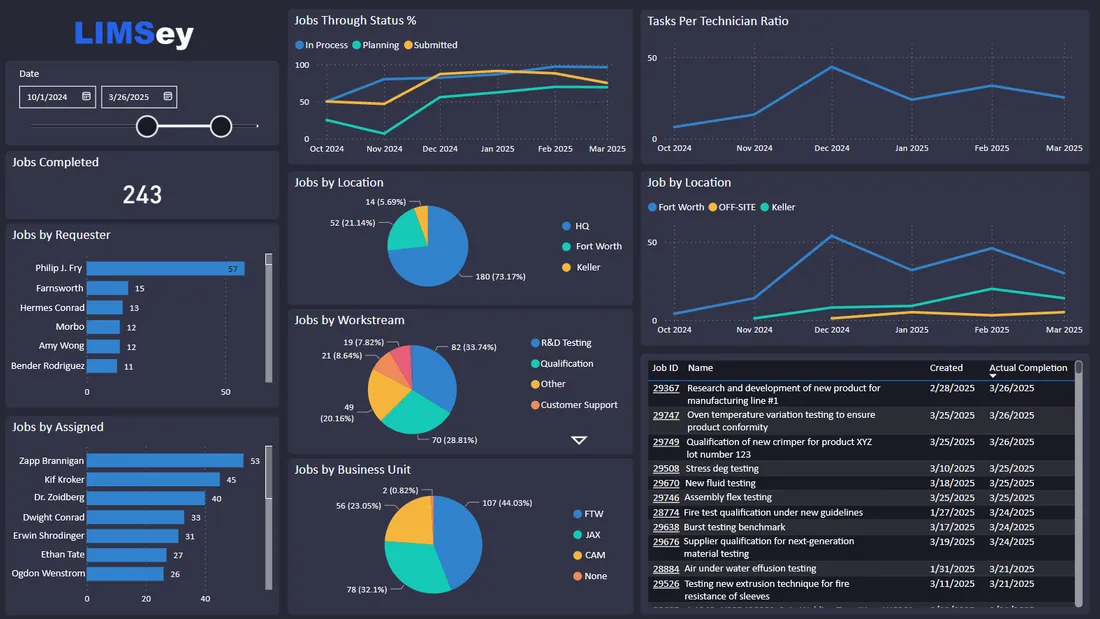
When leadership wants a specific picture, you don't have to learn a chart builder — tell us what you want to see and we design the dashboard for you. We start from our templates and customize until it fits your KPIs exactly, and when you need a new view later, you just ask.
- Jobs by technician, workstream, and requester
- Equipment utilization and downtime
- Job costing — labor hours and equipment rates rolled up per job
- Live data tables feed Power BI and other BI tools for org-wide reporting
Monitor changes over time
Track how test results change over time across all products or a select few — and detect issues before they become real problems.
Ask instead of build
LIMSey's built-in AI Assistant answers questions about your lab data in plain English — completed jobs last month, busiest technician, biggest bottleneck — with instant charts and tables.
Give leadership the picture they keep asking for
Book a demo and see your lab's KPIs the way management wants them.